
Papermaking effects through sheet density
Here we shall consider the elastic modulus vs. paper density, implicitly assuming that apparent density and not effective density faithfully reflects changes in RBA. As a result, we obtain a compact representation of the elastic modulus. The actual density-to-RBA relationship may vary from one furnish to another, but we do not study such variations here.
In a given paper grade and at a fixed grammage, density and elastic modulus depend on beating, wet pressing, and the mixing of different pulp components. Section 3.5 will discuss pulp mixtures. Figures 1 and 2 illustrate the effect of beating and wet pressing, respectively. The examples provide a wide range of modulus and density values.
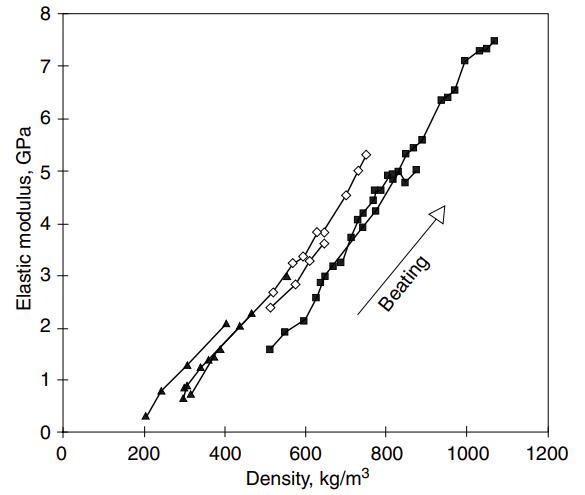
Figure 1. Elastic modulus vs. density when beating varies. Each line connects the data for one wood species, pulp type, and fixed wet pressing level 1,2.
When the beating degree varies as in Figure 1, the threshold density, ρ0, appears to vary from 200 to 400 kg/m3, depending on the furnish type and constant level of wet pressing. The slope, E*, seems rather independent of wood species, including the difference between earlywood and latewood, and the type of pulp. The slight curvature at low densities shows a deviation from the high-density approximation that Eq. 8 in Elasticity represents.
The situation is qualitatively similar when wet pressing is the control variable, as shown in Figure 2. Only with mildly beaten pulps can density vary by changing wet pressing. If one ignores the points at the lowest density below 300 kg/m3, the threshold density, ρ0, is practically independent of the furnish at ρ0 ≈ 200 kg/m3. The slope, E*, does vary. Incidentally, the same value of ρ0 also applies to the grammage data shown in Fig. 3 in Elasticity where only RBA varies.
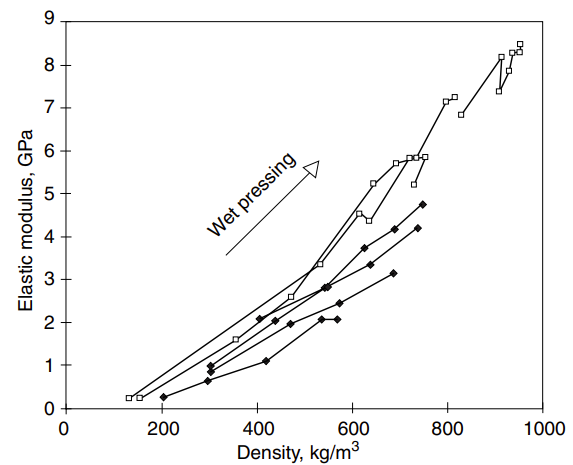
Figure 2. Elastic modulus vs. density when wet pressing varies. Each line connects the data for one wood species, pulp type, and fixed beating level 2.
Figure 2 qualitatively summarises the experimental observations. The plot does not apply to poorly bonded sheets with ρ ≥ 300 kg/m3. One possibility to explain these results in terms of Eq. 8 in Elasticity is that (1) the threshold density, ρ0 ≈ 200 kg/m3, is essentially the same for all pulps, and (2) wood species, pulp type, and beating change E*, density and RBA. In this interpretation, the roughly linear density dependence of the elastic modulus for increasing beating in Figure 5 in Elasticity is merely an artefact. Although relatively little data have so far been analysed, this view is supported by an analysis of the internal stresses at the fibre segment level 3.
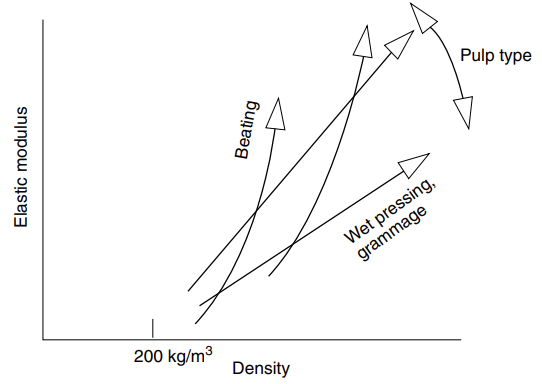
Figure 2. Schematic density dependence of elastic modulus in reasonably well-bonded paper sheets.
Drying stresses
As shown in Figure 3, the elastic modulus increases if shrinkage is limited during drying or if wet paper is strained. At high levels of shrinkage, the elastic modulus is inversely proportional to the drying shrinkage that was allowed 4. When comparing different furnishes in fully restrained and free drying, the difference E (restrained drying) – E (free shrinkage) is large for pulps with a high shrinkage potential. Chemical pulps are therefore more sensitive to drying shrinkage than mechanical pulps, and well beaten chemical pulps are more sensitive than lightly beaten pulps. Even when shrinkage is completely free, a well beaten furnish gives a higher elastic modulus than a lightly beaten furnish 4.
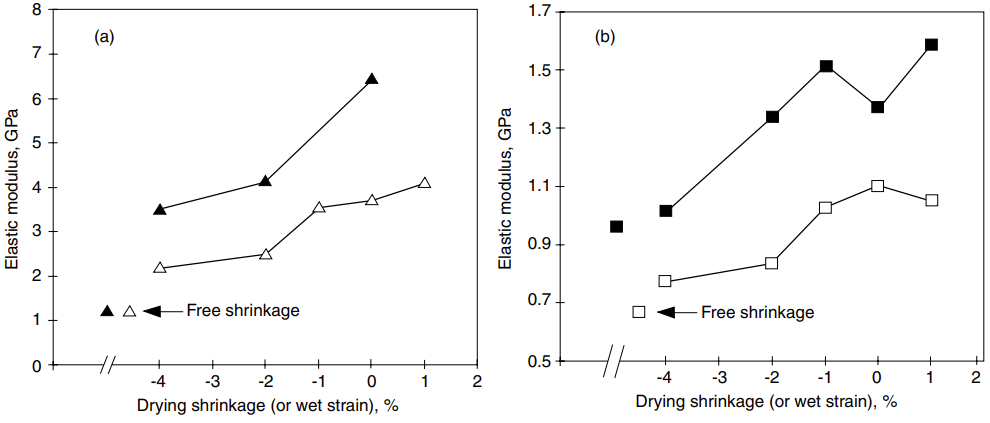
Figure 3. Elastic modulus vs. drying shrinkage or wet strain for an unbleached kraft pulp (a) and a groundwood pulp (b) at a low and high level of beating (open and closed symbols, respectively) 4.
The next section discusses the anisotropy of the elastic properties of paper in detail. We note here that when comparing completely free shrinkage and zero shrinkage, the relative change of elastic modulus between the two cases is insensitive to fibre orientation, as shown in Figure 4. In absolute units, the difference between the two shrinkage levels is larger in MD than CD because the elastic modulus is always larger in the first case.
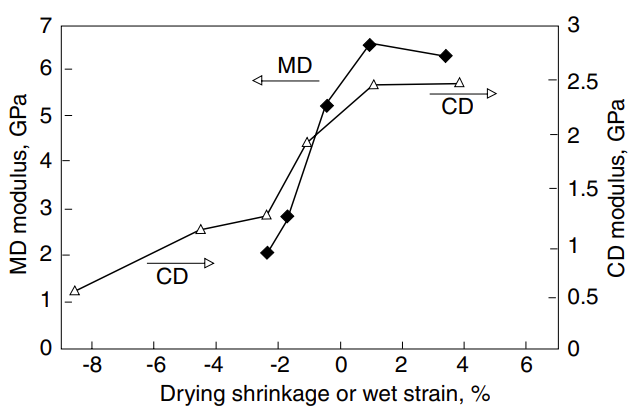
Figure 4. MD and CD elastic modulus (triangles and diamonds, respectively) in oriented handsheets vs. the uniaxial drying shrinkage or wet strain in the same direction. No restraint applied in the lateral direction 4.
In the experiments displayed in Figures 3 and 4, paper was allowed to shrink freely until reaching a preset limit after which no more shrinkage was allowed. One can also control the drying stress so that shrinkage is prevented until the solids content and therefore elastic modulus are sufficiently high, allowing the internal shrinkage pressure of the paper to overcome the drying stress. It has been argued that the elastic modulus is then linearly proportional to the drying stress, and furthermore that if different furnishes are compared at full restraint, the final drying stress-elastic modulus data fall on a single line through the origin 5. However, these relationships are true only in very carefully standardised drying conditions. Otherwise, if different drying conditions are compared, there is no general relationship between drying stress and elastic modulus 6.
The changes in the elastic properties of paper induced by drying shrinkage relate to corresponding changes in single fibres. Experiments by Jentzen and Dumbleton have shown that the axial elastic modulus of a fibre increases if the fibre dries under tension and decreases if the fibre dries under compression 7. In the network, compressive drying stresses act on bonded fibre segments, and the elastic modulus of fibres decreases locally. Free fibre segments can simultaneously dry under tension if one limits sheet shrinkage; see Chapter 2 (Fibres and bonds) for a discussion. The average net effect on the bonded and free fibre segments controls the elastic modulus of paper. A quantitative demonstration of this is given in Ref. 3.
In analogy to decreasing drying shrinkage, wet straining increases the elastic modulus of paper, as shown in Figures 3 and 4. Wet straining straightens fibres in the straining direction and removes some of the z-directional “undulations” of fibres. The effect of wet straining disappears at large strain levels, presumably because the network stratification and microfibril alignment can no longer increase. Fibres may instead slide past one another in the wet web.
Elastic anisotropy and CD profiles
Even if the Cox theory expressed by Eq. 9 in Elasticity does not give quantitatively correct predictions for the density dependence of the elastic modulus, it is useful in expressing the effect of fibre orientation on the elastic anisotropy. The result 8 can be expressed as
(1)
The Fourier coefficients, an, of the fibre orientation distribution were defined in Chapter 1 (Paper structure). The specific elastic modulus of fibres, E*, is assumed constant and independent of their orientation. This corresponds to isotropic drying stress and no wet strain. The fibre modulus will otherwise vary depending on orientation. The prefactor, Φ, accounts for the inactive fibre ends or Φ = 1 – ρ0/ρ in terms of Eq. 8 in Elasticity.
Experiments 9 confirm that the fibre orientation dependence of the elastic moduli, EMD and ECD, is consistent with Eqs. 1. In the experiments, fibre orientation was measured from dyed fibres. The orientation dependence of the Poisson ratios and shear modulus still lacks verification. Since the second Fourier coefficient, a2 <<1, the shear modulus, G, should be only a weak function of fibre orientation.
In machine-made papers, the MD wet strain and anisotropic drying stresses render Eqs. 1 invalid because the elastic modulus, E*, of a fibre will depend on its orientation in the final paper sheet. Wuu et al. 10 have demonstrated this by testing fibres cut from paper sheets. In their measurements, the fibres that were aligned in MD had 50% higher elastic modulus than the fibres in CD.
Despite the orientation-dependence of E*, the geometric mean of the MD and CD elastic moduli of paper, , remains almost invariant if fibre orientation anisotropy varies but drying restraints remain constant 11, as shown in Figure 5. The same conclusion follows from Eqs. 1, when E* is constant.
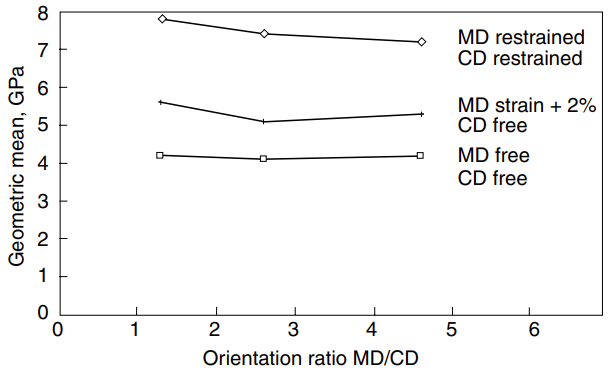
Figure 5. Geometric mean, , of MD and CD elastic moduli vs. fibre orientation ratio, RE = EMD/ECD , in handsheets dried under different restraints 11.
Experiments and a model calculation suggest that when fibre orientation is constant and only drying shrinkage varies, then Egeom is linearly proportional to the modulus ratio 12, RE = EMD/ECD. This applies to the variation of the elastic moduli across a paper machine web, as shown in Figure 6. The variation arises because the edges of the web shrink more than the centre. Fibre orientation anisotropy is usually constant across the web.
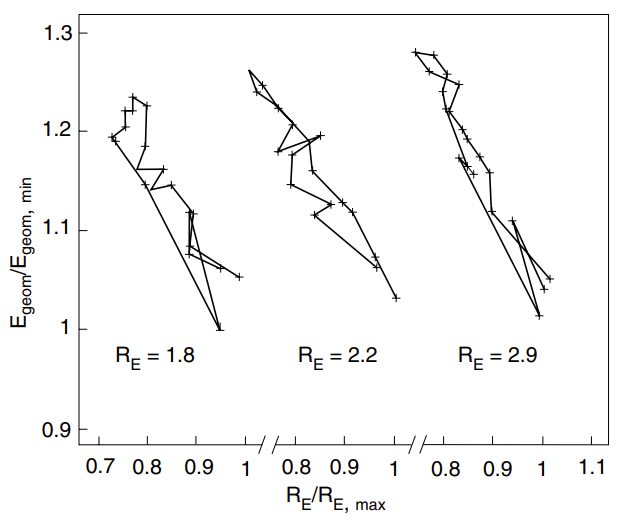
Figure 6. Geometric mean, , of MD and CD elastic moduli vs. fibre orientation ratio, RE = EMD/ECD , in full-size copy paper webs at three levels of fibre orientation anisotropy. The lines trace the variation in the modulus ratio, from a maximum at one edge to a minimum in the centre and then to another maximum at the other edge. The values of Egeom and RE are divided by the values at the edge where Egeom has its minimum and RE its maximum 12.
Because of the drying shrinkage, CD mechanical properties of paper vary across the web. The elastic modulus and tensile strength are smaller and breaking strain is larger at the edges than in the centre of the web. MD properties vary much less than CD properties. The EMD is often 10% higher in the centre of the web than at the edges. In ECD, the corresponding difference is typically 30%. As Figure 7 illustrates, the profile variation of shear modulus is intermediate to the MD and CD properties.
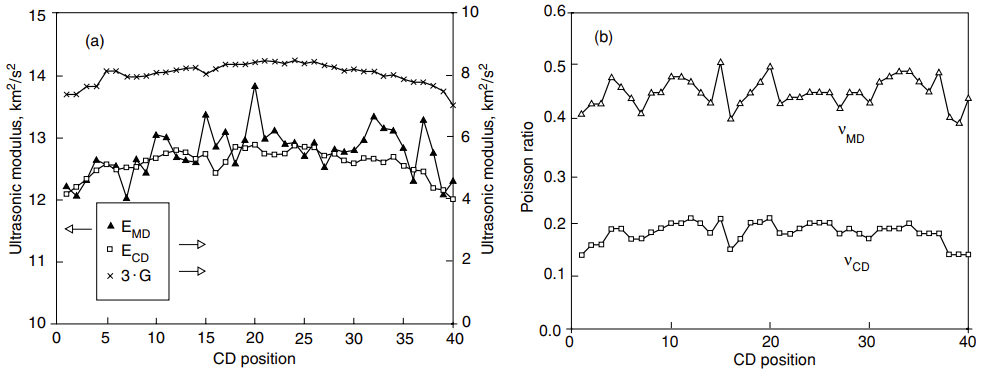
Figure 7. Across-the-web profiles of EMD, ECD, and G (a), and νMD and νCD (b) on a full-size copy paper machine using ultrasonic measurements. ECD and 3·G are on the right-hand scale (KCL, unpublished data).
The shrinkage-induced smooth variation across the web differs clearly from sporadic variations that may arise from nonuniformities in the fibre orientation profile.